The most important part of any business is the data. You need to have good data to make good decisions, which is why it’s essential to have a good dashboard to manage your kpi data. A good KPI dashboard will help you to see the big picture, so you can make better decisions about your business. It’ll also help you to see how your business is performing, and which areas need more attention.
What is a KPI Dashboard?
A dashboard is a graphical representation of key performance indicators (KPIs). A business-wide dashboard might contain data from all of the company’s divisions, locations, or product lines. A departmental or unit-specific dashboard might have data only from the company’s operations within that department or unit.
What do KPI dashboards include?

One of the most important aspects of any business is its performance. This is especially true in the case of companies that provide goods or services to their customers. To ensure that the company is meeting customer expectations and meeting financial objectives, it is necessary to have accurate data about performance. This data can be gathered through a variety of methods, including performance metrics such as sales, customer satisfaction, and budget overruns. One popular way to collect performance data and display it is as a dashboard. A dashboard typically contains a variety of information, including performance data from various areas of the business, trend data, and company statistics. Since a dashboard provides an overview of performance, it can be used to identify problems and make necessary changes. By using a dashboard to monitor performance, companies can ensure that they are meeting customer expectations and meeting financial objectives.
Executive KPI Dashboard
A good, effective KPI management system can help a business track progress and make informed decisions about how to grow. There are many types of KPIs, but executive KPI dashboards are perhaps the most common. An executive KPI dashboard is typically used to track the performance of a company’s senior executives. Tracking progress and making informed decisions about growth is important, but it’s not the only function of a good KPI management system. A good KPI management system can also help identify problems and track their effects. Thus, a good KPI management system has a good deal of both executive and business functionality.
Operational Dashboard
A business’s operational dashboard is a vital tool for monitoring performance and making informed strategic decisions. The dashboard includes key performance indicators or “kpi” (short for “key performance indicators”), data from business operations, and other related information. By tracking and analyzing key performance indicators, businesses can optimize their operations and reflect their successes on a regular basis. This helps keep the business on track and provides a benchmark for future improvement.
Analytical Dashboard

An analytical dashboard is a reporting tool that enables businesses to optimize their operations and make better decisions. A dashboard can be helpful for business owners who want to see how their company is doing overall and to identify areas for improvement. Often, dashboards are prepared as visual representations of key data. For example, a business might track revenue, cost of goods sold, and profits on an analytic dashboard.
A business kpi is a quantitative or qualitative measure of business performance that businesses use to measure progress, optimize operations, and identify areas for improvement. There are many different types of business kpi, and they can be focused on different areas such as financial performance, customer satisfaction, or employee productivity. When constructing an analytic dashboard, it is important to identify the right KPIs to measure. Often, business owners will start by looking at the data that is available to them. However, it is important to keep in mind that not all data is useful for measuring performance. For example, data that is sourced from customers or employees may not be reliable or accurate. It is also important to consider the timeframe over which the data will be
Sales indicators
A sales KPI is a measure of a company’s sales performance. By understanding your sales metric, you can improve your sales strategy and measure your success. A sales indicators might include things like the number of new licenses sold, the number of new accounts created, or the average revenue per user. By understanding your sales KPI, you can make targeted changes to your marketing strategy and sales tactics to improve your results. Businesses use different sales metrics, so it’s important to track and monitor your progress regularly. By understanding your sales KPI, you can ensure that your company’s performance is always improving.
How to create a dashboard?
If you’re looking for a way to create dashboards based on your company’s specific data needs, then you may want to consider using a dashboard tool like Finoko. This tool makes it easy to create interactive dashboards that can help you better understand your company’s performance.
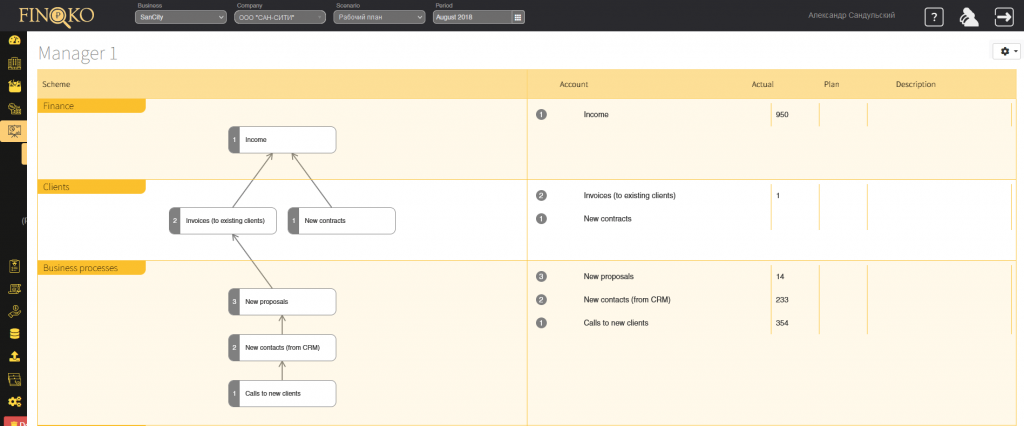
Connect employee goals with business outcomes
To connect employee goals with business outcomes, you need to use a dashboard like the ones typically used for business KPIs. This dashboard will allow you to see how well your employees are meeting their short- and long-term goals, as well as how well the business is achieving its key objectives.
Employee goals are connected with business outcomes dashboard kpi data to help determine whether the business is achieving its key objectives.
The purpose of a business outcome dashboard is to help determine whether the business is achieving its key objectives. To do this, you need to connect employee goals with business outcomes dashboard kpi data. This will give you a strong indication of whether your employees are hitting their targets and whether the business is succeeding overall.
The Future of Data Storytelling
As businesses become increasingly data-driven, they are searching for ways to measure and understand the performance of their data storytelling initiatives. One way to do this is by using kPIs (key performance indicators). A data storytelling dashboard can help businesses track the progress and effectiveness of their data storytelling initiatives by providing them with a visual representation of data-related information. By using data analytics and monitoring tools, businesses can identify trends and make adjustments as needed. This type of dashboard can help businesses get a better understanding of their audience and how best to communicate with them. Additionally, data storytelling dashboards can help businesses identify opportunities and make decisions based on data. By using data storytelling techniques and monitoring tools, businesses can create powerful and engaging data stories that will help them achieve their goals.